Up to 45% Less Memory, Zero Compromise: Smart Java Workload Optimization on Kubernetes
Why Java Workloads Are Hard to Optimize on Kubernetes
Java applications on Kubernetes present unique optimization challenges that generic resource tuning tools can't solve.
The Memory Blind Spot
Most Kubernetes optimization tools---including VPA and many commercial platforms---only see container-level metrics like RSS and Working Set. But for Java workloads, the real story is inside the JVM:
- Container metrics lie. A container reporting 4 GB memory usage tells you nothing about whether JVM Heap is overprovisioned by 2 GB or about to trigger a Full GC.
- Heap too large: memory sits idle, inflating cloud spend for no benefit.
- Heap too small: GC pressure rises, latency spikes, and OOMs become a matter of time.
- Manual tuning doesn't scale. Getting
-Xmxright requires deep JVM expertise, and the optimal value shifts as traffic patterns change. Tribal knowledge doesn't survive team turnover.
The root cause: container-level rightsizing and JVM Heap tuning are treated as two separate problems, when they should be one coordinated optimization loop.
The Startup Spike Dilemma
Java apps consume far more CPU during startup (class loading, JIT compilation, Spring context initialization) than at steady state. Without automation, teams face an impossible choice---we expand on this in the ResourceStartupBoost section below.
Real-World Impact
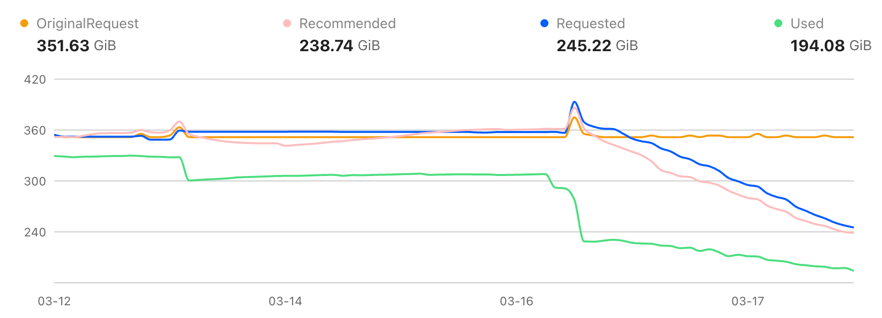
One customer onboarded multiple Java-based clusters to CloudPilot AI Workload Autoscaler. After the optimization pipeline took effect, actual memory consumption dropped dramatically across the board---without any manual tuning or service disruption.
In Cluster A, actual memory usage dropped from ~352 GiB to 194 GiB---a 45% reduction---while Requested memory was right-sized from 352 GiB down to 245 GiB.
In Cluster B, actual memory usage dropped from ~255 GiB to 154 GiB---a 40% reduction---with Requested memory decreasing from 255 GiB to 235 GiB.
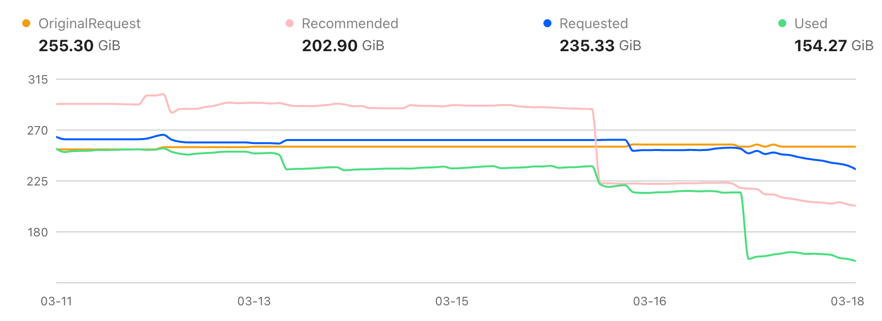
Across both clusters, the optimization eliminated over 250 GiB of memory consumption---a combined 43% reduction.
These are not Requests/Limits changes on paper. The savings come from real memory consumption, driven by joint JVM Heap and container-level optimization.
Our Solution
Java Memory Optimization: From "Container Tuning" to "JVM + Container Joint Optimization"
Core Capabilities
- JVM-level observability:
cloudpilot-node-agentcaptures Heap Used/Committed/Max, GC frequency, GC pause time, and GC pressure trends---so decisions aren't based only on outer container metrics. - Direct Heap governance: Heap recommendation ranges (including
-Xmx) are managed directly and coordinated with Pod memory recommendations in a single optimization loop. - GC risk control: GC pressure, pause behavior, and allocation rates are factored into every recommendation, so cost savings never come at the expense of reliability.
How Memory Recommendations Work
The goal is not simply to "shrink memory"---it's to find the sweet spot between stability and efficiency:
- Observe --- Collect JVM metrics (Heap, GC, allocation trends) alongside container metrics (RSS, OOMKill history, restarts).
- Model --- Estimate true Heap demand using multi-window percentiles, down-weighting outliers like deployment-time jitter.
- Recommend --- Produce a coordinated pair: a target
-Xmxrange (with burst buffer and GC safety margin) and matching Pod Requests/Limits that account for non-Heap overhead (Metaspace, Code Cache, Thread Stacks, native memory). - Validate --- After rollout, continuously monitor GC, latency, OOM, and utilization. Readjust when risk thresholds are crossed.

ResourceStartupBoost: Solving Java Startup Resource Spikes
Java applications have fundamentally different resource profiles during startup versus steady state. Without ResourceStartupBoost, teams are stuck choosing between two imperfect strategies:
The Two-Choice Dilemma
Option A: Size for steady state
If you set Requests/Limits based on steady-state usage, startup suffers:
- CPU throttling during class loading, JIT compilation, and Spring context initialization causes slow or failed startups.
- Readiness probes time out, triggering repeated restarts and cascading scheduling pressure.
- In rolling deployments, new Pods can't come up fast enough, leading to capacity gaps and user-facing errors.
Option B: Size for startup peak
If you set Requests/Limits high enough to cover startup spikes, steady state becomes wasteful:
- Resources reserved for a burst that lasts only minutes sit idle for hours or days.
- The scheduler sees inflated Requests and bins Pods less efficiently, reducing cluster-wide packing density.
- Cloud spend goes up with no performance benefit during normal operation.

Our Approach: Get Both
ResourceStartupBoost eliminates this trade-off by decoupling startup configuration from steady-state configuration:
- Startup (Boost Window): Temporarily increases Pod CPU/Memory Requests/Limits to absorb peak startup overhead---ensuring fast, reliable startups with no throttling or timeout failures.
- Steady State: Automatically falls back to recommended steady-state values after stabilization---recovering the resources and keeping cluster packing density high.
The result: startup reliability of Option B and cost efficiency of Option A, without any manual profile management.

Why This Requires Node Autoscaler Coordination
ResourceStartupBoost doesn't work in isolation---it relies on tight coordination with CloudPilot's Node Autoscaler. Here's why:
After a startup boost window completes, Pod CPU requests drop back to steady-state levels (e.g., from 4 cores to 1 core). A standalone Node Autoscaler only sees these low steady-state requests. It concludes the node has plenty of free capacity, packs more Pods onto it, or even scales down "underutilized" nodes.
The problem surfaces when a Pod restarts---during a rolling update, a crash recovery, or rescheduling. The Pod needs its startup boost again (e.g., 4 cores), but the node was packed based on steady-state numbers and has no room. The result: the Pod goes pending, the cluster scrambles to provision a new node, and the restart that should have taken seconds now takes minutes.
CloudPilot solves this by making the Node Autoscaler boost-aware. It knows every workload's startup boost profile and factors that potential demand into bin-packing and scaling decisions. The Node Autoscaler reserves enough headroom so that when any Pod restarts, the startup boost fits immediately---without emergency node provisioning and without over-provisioning the entire cluster "just in case."

Under the Hood
CloudPilot AI Workload Autoscaler runs a dedicated optimization pipeline for every Java workload:
- Identification:
cloudpilot-node-agentdetects each Pod's language and runtime profile, then automatically classifies the workload byRuntimeLanguage. - Observation: It collects key JVM metrics (Heap Used/Committed/Max, GC frequency, GC pause time, GC pressure trends, container RSS/Working Set, plus Pod OOM and restart history).
- Decisioning: It models both stability goals (avoid OOM, reduce Full GC risk) and cost goals (eliminate idle memory waste), then outputs Pod resource recommendations plus JVM Heap recommendations.
- Execution: It coordinates Kubernetes Requests/Limits with JVM settings (such as
-Xmx) and continuously tunes based on feedback. - Startup Boost: During startup windows, it enables
ResourceStartupBoostto temporarily raise resources, then scales back to steady-state recommendations once the app stabilizes.

How We Compare
We evaluated the most common alternatives across key Java-specific optimization capabilities. While all platforms handle basic container Requests/Limits tuning, the differences emerge in JVM-level intelligence and startup-phase awareness.
| Capability | Open-source VPA | Cast AI | ScaleOps | CloudPilot AI |
|---|---|---|---|---|
| Container Requests/Limits tuning | Yes | Yes | Yes | Yes |
| JVM Heap/GC observability | No | No | Yes | Yes |
Direct -Xmx management | No | No | Yes | Yes |
| Heap + GC risk-linked decisions | No | No | No | Yes |
| Startup vs. steady-state separation | No | No | No | Yes |
- Open-source VPA operates entirely at the container layer. It has no visibility into the JVM, making it prone to either over- or under-provisioning Java Heap.
- Cast AI provides strong container-level rightsizing with in-place pod resizing, but does not offer JVM-level observability or Heap parameter management. For startup spikes, it relies on Kubernetes-native mechanisms (e.g., startup probes, removing CPU limits) rather than an integrated boost-and-fallback workflow.
- ScaleOps introduced JVM-aware resource management in late 2025, offering Heap/GC observability and
-Xmxtuning. However, its optimization decisions focus on aligning Heap with container memory rather than building GC risk signals (pause time, pressure trends, allocation rate) directly into the recommendation model. It also does not offer startup vs. steady-state resource separation. - CloudPilot AI combines JVM-level observability, direct
-Xmxgovernance with GC risk-aware decision-making, andResourceStartupBoostfor phase-aware resource management---delivering a complete closed-loop optimization pipeline.
Conclusion
Java workloads don't just need smaller containers---they need coordinated JVM and container optimization. CloudPilot AI Workload Autoscaler delivers this through three reinforcing capabilities:

In production, this translates to 40--45% actual memory reduction across customer clusters---savings that come from real consumption, not just paper adjustments to Requests and Limits.
Ready to see what CloudPilot AI can do for your Java workloads? Talk to our team to learn more.