Background
For Kubernetes workloads with large images, cold start has two parts: the node prepares the image, then the application starts. Before a service can load code, plugins, configuration, models, or indexes, containerd first has to make the image filesystem available.
With the traditional containerd overlayfs path, the node downloads and unpacks the image before the container can start. Lazy loading changes that sequence. Instead of requiring the whole filesystem to be fully local before process start, the image is mounted through an index and files are fetched when they are accessed.
Hermes makes this workflow policy-driven. Application teams keep using their original OCI images. They do not need to rebuild images, publish converted tags, change Dockerfiles, or update Pod image references. The platform team defines a HermesPolicy, and Hermes prepares the lazy-loading artifacts in the cluster.
The previous Hermes benchmark focused mostly on Pod Ready and image pull behavior. This test goes one step further: it measures the path from a Pod being scheduled on a fresh EKS node to the first successful HTTP 200 response from the service.
This keeps the measurement close to the part Hermes can affect: image pull, mount, container start, and the application startup that follows. First HTTP 200 still includes runtime initialization, library and configuration reads, plugin loading, model or index loading, and service bootstrap, so the percentage gain is smaller than the raw image-pull gain.
What We Tested
We tested three HTTP workloads with large public images. They happen to be Java-based, but Hermes runs below the application runtime: it changes how the image filesystem is prepared and read, not how Java starts.
- Solr:
docker.io/library/solr:10.0.0 - OpenSearch:
docker.io/opensearchproject/opensearch:2.19.1 - Spark master:
docker.io/apache/spark:python3-java17
The Pods used the upstream public images, pinned by digest. No Hermes-specific converted image tag was introduced.
We compared two paths:
overlay: standard containerd overlayfs image pull and unpack.Hermes: the same workload image, with the Hermes lazy-loading path on the target node.
Each service and variant ran three times, for a total of 18 target runs.
Test Environment
The benchmark ran on EKS:
- Kubernetes:
v1.34.9-eks-93b80c6 - Node OS: Amazon Linux 2023
- Runtime: containerd
2.2.4 - Target instance type:
m6i.large - Platform:
linux/amd64 - Node isolation: each target run used a fresh target node
For every run, the benchmark removed the previous target node before starting the next run. This avoids measuring a local image cache left behind by a previous Pod.
Experiment Steps
Step 1: Install the Hermes Controller and CRD
The controller watches HermesPolicy resources and Pods. When it observes a matching image, it builds and caches the lazy-loading artifacts.
kubectl apply -f deploy/hermespolicy-crd.yaml
kubectl apply -f deploy/hermes-controller-eks.yaml
kubectl -n hermes-system rollout status deploy/hermes-controller
Step 2: Configure Two Target NodePools
The test used two NodePool/NodeClass pairs:
- an overlay NodePool: standard AL2023/containerd overlay path.
- a Hermes NodePool: AL2023/containerd with the Hermes daemon installed through EC2NodeClass
userData.
The Hermes-enabled NodeClass installed the daemon during node bootstrap:
export HERMES_INSTALLER_URL="..."
export HERMES_DAEMON_URL="..."
export HERMES_DAEMON_SHA256="..."

curl -fsSL "${HERMES_INSTALLER_URL}" | \
  HERMES_DAEMON_URL="${HERMES_DAEMON_URL}" \
  HERMES_DAEMON_SHA256="${HERMES_DAEMON_SHA256}" \
  bash -s --
Both NodePools used the same instance type and capacity type.
Step 3: Create the HermesPolicy
The policy selected the three benchmark workload images:
apiVersion: hermes.cloudpilot.ai/v1alpha1
kind: HermesPolicy
metadata:
  name: benchmark-images
spec:
  imageSelectors:
    - imageRegex: '.*(solr:10\.0\.0|opensearchproject/opensearch:2\.19\.1|apache/spark:python3-java17).*'
  platforms:
    - linux/amd64
Step 4: Wait for Artifacts to Be Ready
Hermes artifact preparation is outside the target Pod startup timing window. It is a controller-side preparation step for matching images.
In this run, preparation took:
- Solr: 58.918s
- OpenSearch: 2m44.999s
- Spark: 1m4.493s
The target workload benchmark started after the artifacts reached Ready.
Step 5: Run Fresh-Node Target Pods
For each service and variant, the benchmark:
- Deleted any previous target Pod and Service.
- Removed the previous target node.
- Waited for the target node to be fully gone.
- Created a watcher Pod on a stable node.
- Created the target workload Pod on a fresh target node.
- Recorded image pull, container start, Pod Ready, and first HTTP 200 timing.
The first HTTP 200 timestamp was recorded after the watcher received a successful HTTP response, not before sending the request.
Step 6: Workload YAML and HTTP 200 Probe
The same application YAML was used for both variants. The only scheduling difference was the target node pool: hermes-overlay for the overlay run and hermes-startuplocal for the Hermes run.
Each target Pod was exposed by a headless Service. The Service selected one run-specific Pod through app, variant, and e2e-run labels:
apiVersion: v1
kind: Service
metadata:
  name: opensearch-overlay-r1-20260622025902-ope
  namespace: hermes-e2e
spec:
  clusterIP: None
  publishNotReadyAddresses: true
  selector:
    app: opensearch-e2e
    variant: overlay
    e2e-run: 20260622025902-opensearch-overlay-r1
  ports:
    - name: http
      port: 9200
      targetPort: http
publishNotReadyAddresses: true lets the watcher resolve and call the Pod through Service DNS before the Pod is marked Ready. Without this, the Service would usually hide the endpoint until readiness succeeds, which would make it harder to measure the first successful HTTP 200.
Here is the OpenSearch target Pod used in the benchmark. The Hermes run used the same container spec and changed only the run labels/name and karpenter.sh/nodepool selector:
apiVersion: v1
kind: Pod
metadata:
  name: opensearch-overlay-r1-20260622025902-ope
  namespace: hermes-e2e
  labels:
    app: opensearch-e2e
    variant: overlay
    e2e-run: 20260622025902-opensearch-overlay-r1
spec:
  restartPolicy: Never
  terminationGracePeriodSeconds: 1
  nodeSelector:
    kubernetes.io/os: linux
    kubernetes.io/arch: amd64
    karpenter.sh/nodepool: hermes-overlay
  containers:
    - name: opensearch
      image: docker.io/opensearchproject/opensearch:2.19.1@sha256:7ad3c515e43fb1642ddf2181dfd03402e42e85a16030e098ed1f3fc1404d7e89
      imagePullPolicy: IfNotPresent
      args:
        - opensearch
        - -Ediscovery.type=single-node
        - -Ehttp.host=0.0.0.0
        - -Etransport.host=127.0.0.1
      env:
        - name: OPENSEARCH_JAVA_OPTS
          value: "-Xms512m -Xmx512m"
        - name: DISABLE_SECURITY_PLUGIN
          value: "true"
      ports:
        - name: http
          containerPort: 9200
      readinessProbe:
        httpGet:
          path: /_cluster/health?local=true
          port: http
        periodSeconds: 1
        timeoutSeconds: 1
        failureThreshold: 900
      resources:
        requests:
          cpu: "1"
          memory: "2Gi"
          ephemeral-storage: "8Gi"
        limits:
          memory: "3Gi"
Solr and Spark used the same Pod shape. Their workload container blocks were:
# Solr
- name: solr
  image: docker.io/library/solr:10.0.0@sha256:c5d3e51740f81612dac200c91908c253bf8302dca330874d6dcef23dacafc723
  imagePullPolicy: IfNotPresent
  env:
    - name: SOLR_HEAP
      value: "512m"
  ports:
    - name: http
      containerPort: 8983
  readinessProbe:
    httpGet:
      path: /solr/admin/info/system
      port: http
    periodSeconds: 1
    timeoutSeconds: 1
    failureThreshold: 900
  resources:
    requests:
      cpu: "500m"
      memory: "1Gi"
      ephemeral-storage: "4Gi"
    limits:
      memory: "3Gi"

# Spark master
- name: spark-master
  image: docker.io/apache/spark:python3-java17@sha256:6fb854a580e552290a21d7b9c6214f2d8840733e63a90ff687a2ffce80f45ef9
  imagePullPolicy: IfNotPresent
  command:
    - /opt/spark/bin/spark-class
  args:
    - org.apache.spark.deploy.master.Master
    - --host
    - 0.0.0.0
    - --port
    - "7077"
    - --webui-port
    - "8080"
  ports:
    - name: web
      containerPort: 8080
    - name: master
      containerPort: 7077
  readinessProbe:
    httpGet:
      path: /
      port: web
    periodSeconds: 1
    timeoutSeconds: 1
    failureThreshold: 900
  resources:
    requests:
      cpu: "500m"
      memory: "1Gi"
      ephemeral-storage: "4Gi"
    limits:
      memory: "4Gi"
The HTTP 200 timestamp came from a separate watcher Pod running on a stable managed node. It repeatedly called the Service DNS name and printed first_http_200_ns only after receiving HTTP status 200:
apiVersion: v1
kind: Pod
metadata:
  name: watch-opensearch-overlay-r1-20260622025902-ope
  namespace: hermes-e2e
  labels:
    app: opensearch-first-200
    variant: overlay
    e2e-run: 20260622025902-opensearch-overlay-r1
spec:
  restartPolicy: Never
  nodeSelector:
    eks.amazonaws.com/nodegroup: eks-spot-20260620152041180300000015
  containers:
    - name: watcher
      image: python:3.12-alpine
      imagePullPolicy: IfNotPresent
      env:
        - name: TARGET_URL
          value: http://opensearch-overlay-r1-20260622025902-ope.hermes-e2e.svc.cluster.local:9200/_cluster/health?local=true
      command:
        - sh
        - -lc
        - |
          python - <<'PY'
          import os
          import time
          import urllib.request

          url = os.environ["TARGET_URL"]
          print(f"watcher_start_ns={time.time_ns()}", flush=True)
          while True:
              try:
                  with urllib.request.urlopen(url, timeout=0.5) as response:
                      if response.status == 200:
                          print(f"first_http_200_ns={time.time_ns()}", flush=True)
                          break
              except Exception:
                  pass
              time.sleep(0.25)
          PY
Results
| Service | Overlay pull | Hermes pull | Pull reduction | Pull delta | Overlay scheduled -> HTTP 200 | Hermes scheduled -> HTTP 200 | HTTP 200 reduction | HTTP 200 delta |
|---|---|---|---|---|---|---|---|---|
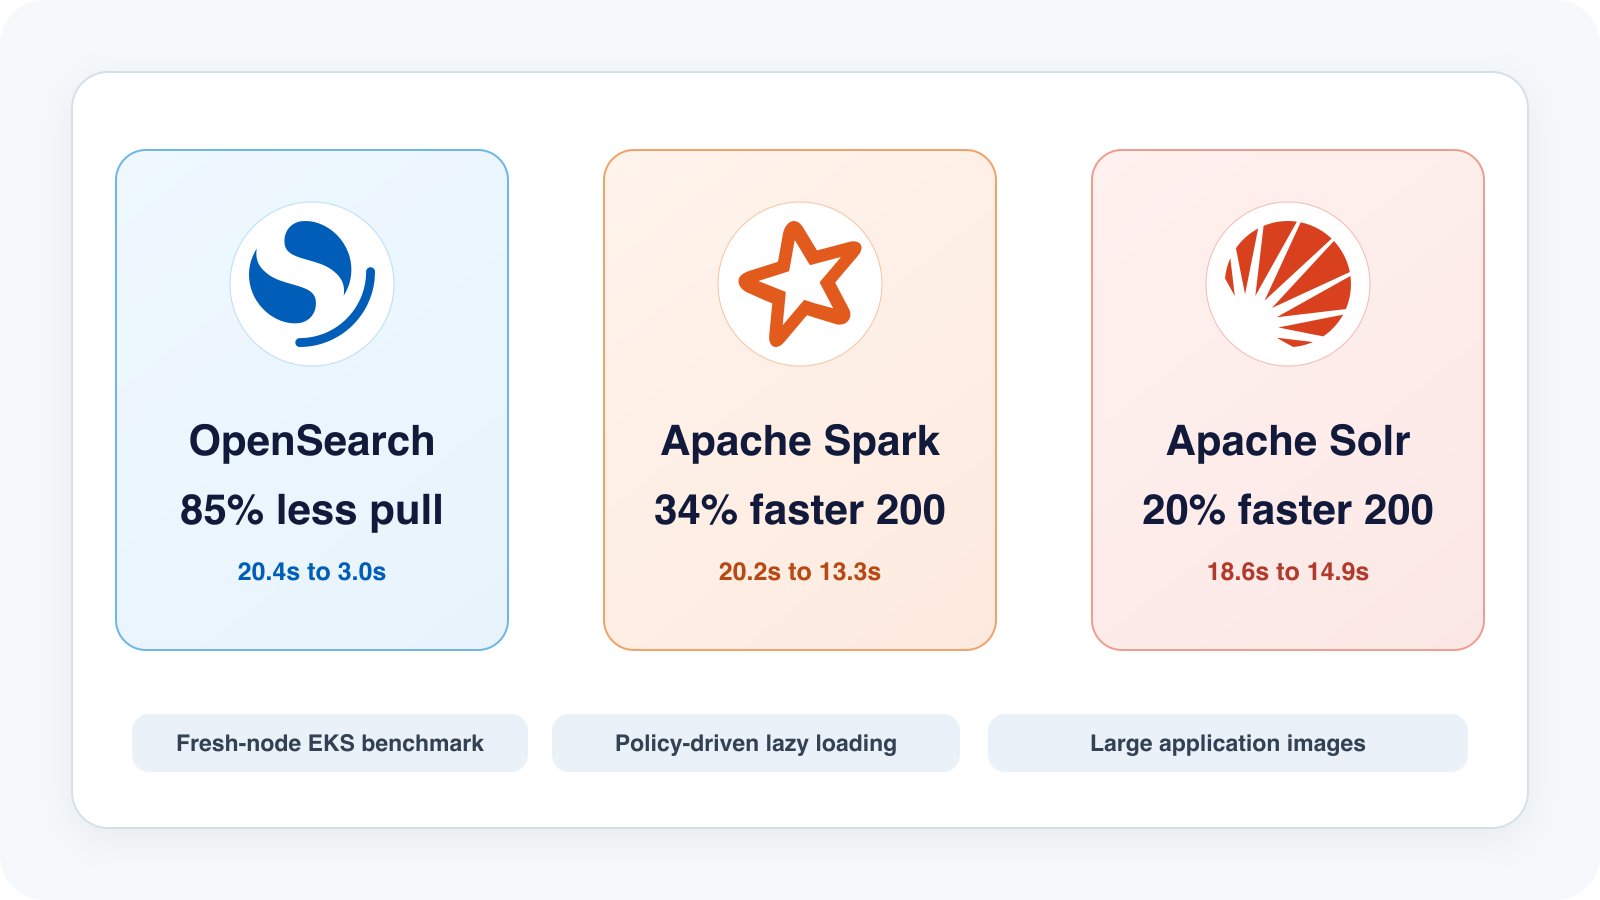
| OpenSearch | 20.371s | 2.998s | 85.28% | -17.373s | 37.943s | 30.375s | 19.95% | -7.568s |
| Solr | 9.053s | 2.584s | 71.46% | -6.469s | 18.572s | 14.919s | 19.67% | -3.653s |
| Spark | 15.763s | 3.811s | 75.82% | -11.952s | 20.191s | 13.304s | 34.11% | -6.887s |
OpenSearch showed the biggest pull-time change, from 20.371s to 2.998s. Spark showed the biggest first-HTTP-200 change, from 20.191s to 13.304s.
What These Numbers Mean
Hermes had the clearest effect on image pull. Across the three workloads, image pull time dropped by 71% to 85%.
First HTTP 200 improved by 20% to 34%. That number is lower than the pull-time improvement because first HTTP 200 includes more than image pull:
- container creation
- process start
- runtime initialization
- code, library, configuration, or model reads
- plugin loading
- service readiness checks
For OpenSearch, the overlay baseline from Pod scheduled to first HTTP 200 was about 38 seconds. Hermes reduced pull time from about 20 seconds to about 3 seconds, and the service reached first HTTP 200 about 7.6 seconds sooner. The remaining time is OpenSearch startup work after the container has already started.
That is why the table shows both image pull and first HTTP 200. Pull time shows the direct image-path effect; first HTTP 200 shows what reached the service boundary.
Conclusion
The benchmark showed a clear image-pull reduction without changing application image references or rebuilding images.
In this EKS test, OpenSearch pull time dropped from 20.371s to 2.998s. Spark first HTTP 200 dropped from 20.191s to 13.304s.
The result is not Java-specific. Hermes works at the image filesystem layer, so the same mechanism applies to any OCI image. These Java-based workloads are just a concrete test set with real HTTP readiness behavior.
Operationally, the workflow stayed simple: the platform prepared the lazy-loading artifacts, while the Pods kept their normal images and specs. The next place to improve is the post-container-start path, where application-critical files should behave closer to a local overlay filesystem.
Follow the project here: https://github.com/cloudpilot-ai/hermes