
Right-Sizing Kubernetes Requests and Limits: How to Avoid OOMKills and Waste
 CloudPilot AICloudPilot AIPublishedSep 10, 2025Read4 min
Introduction: The Hidden Cost of Wrong Requests & Limits
Picture this: Your team just launched a major promotion campaign. Traffic surges exactly as marketing hoped but minutes later, your flagship service crashes.
Pods are in a CrashLoopBackOff state, restarts are piling up, and engineers are scrambling. The culprit? A single container hits its memory limit, triggering an OOMKill.
This isn't an uncommon story. Every Kubernetes engineer knows resource configuration matters, but few realize just how impossible it is to get right manually.
Overprovision, and you're burning money. Underprovision, and you risk outages. The stakes are high, yet the tooling and processes most teams rely on make it nearly impossible to hit the sweet spot.
What Are Requests and Limits?
Kubernetes schedules workloads based on two critical values you define in Pod specs:
resources:
  requests:
    cpu: "500m"
    memory: "256Mi"
  limits:
    cpu: "1"
    memory: "512Mi"
-
Request: The guaranteed amount of CPU or memory for a container. The scheduler uses these numbers to decide where to place the Pod.
-
Limit: The hard cap on what the container can consume at runtime. Exceeding a memory limit triggers an
OOMKill; exceeding a CPU limit results in throttling.
Key behavior difference:
- Requests affect scheduling.
- Limits affect runtime enforcement.
When requests are too high, nodes look "full", leading to poor bin-packing efficiency and unnecessary node scaling. When limits are too low, workloads crash.
The Common Pitfalls in Resource Configuration
Even experienced teams often fall into these traps:
1. Guesswork
Developers set arbitrary numbers, or worse, leave defaults in place. These numbers stick around for months, silently driving waste or risk.
2. Equal Request and Limit
Setting request == limit seems safe but leaves no burst capacity. Memory spikes instantly result in OOMKills.
3. No Limits
Containers without limits can consume unlimited memory, turning one bad deployment into a node-wide outage—a noisy neighbor problem.
4. Overly Conservative Estimates
SREs, burned by outages, often over-allocate. A service needing 300Mi may get a 1Gi request, bloating costs by 3x.
5. Static Configs in Dynamic Environments
Resource profiles change with every release. Static settings quickly become outdated.
Why Manual Right-Sizing Fails
On paper, right-sizing sounds easy:
"Just gather metrics, analyze them, and adjust numbers."
But anyone running Kubernetes at scale knows this is a fantasy. Let's break down why.
Metrics Are Misleading
Metrics dashboards often show averages or 95th percentile values:
kubectl top pod
or via Prometheus queries like:
quantile_over_time(0.95, sum by(pod)(container_memory_usage_bytes)[5m])
But:
- Short-lived memory spikes often don't appear in sampled data.
- The spike you miss is the one that triggers
OOMKill. - To avoid this, teams over-allocate “just in case,” inflating costs.
Workloads Don't Stay Still
Modern microservices are dynamic by design:
- Traffic fluctuates daily, weekly, seasonally.
- Feature releases change memory profiles overnight.
- Yesterday's "perfect" numbers are tomorrow's liability.
Too Many Services to Tune
In a cluster with 100+ services, even spending 30 minutes per service means days of tuning work. Repeat that every sprint, and your SRE team is just firefighting.
Dashboards Don't Tell You What to Do
Grafana or Datadog dashboards look impressive but don't answer the core question:
“What should I set my requests and limits to?”
Most engineers guess, run a deploy, and hope for the best.
VPA Isn't a Silver Bullet
The Vertical Pod Autoscaler (VPA) was designed to solve this, but:
- It restarts Pods to apply new values, unacceptable for many production systems.
- Its recommendations lag behind real-world traffic changes.
- Bursty or unpredictable workloads often get inaccurate values.
Bottom line: Manual right-sizing is like playing darts blindfolded—you might hit the target occasionally, but you’ll waste enormous time and money doing it.
Where to Go From Here
If this resonates, you're not alone. Industry data shows Kubernetes clusters often use only 10–25% of CPU and 18–35% of memory.
Manual right-sizing is unsustainable at scale. The future lies in continuous, automated resource optimization , tools like VPA paved the way, but we now need solutions that:
- Continuously adapt to changing workloads.
- Eliminate Pod restarts when applying changes.
- Optimize for both cost and reliability.
For a monitoring checklist, see Kubernetes resource metrics. For a hands-on look at applying resource updates, follow the in-place Pod resizing walkthrough.
CloudPilot AI Workload Autoscaler automates Kubernetes CPU and memory rightsizing with configurable update policies and integration with node autoscaling.
Contact our team to discuss your workload requirements and deployment options.
Related articles
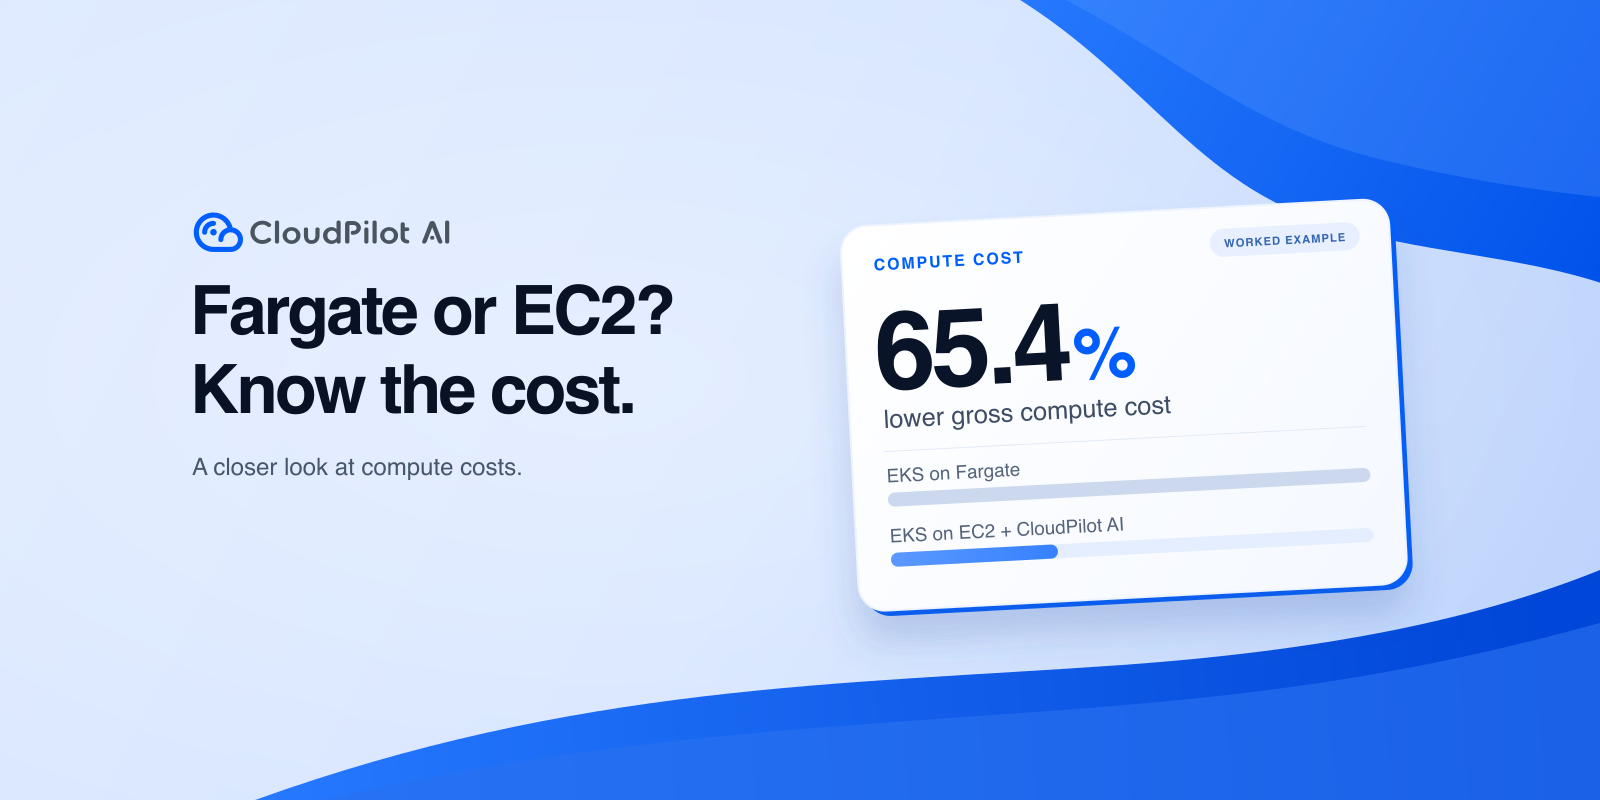
AWS Fargate vs EC2 for EKS: Which Is Cheaper?
Compare EKS on Fargate and EC2 billing, CPU requests and limits, and a worked cost example to decide whether EKS + CloudPilot AI fits your services.
CloudPilot AINov 9, 20269 min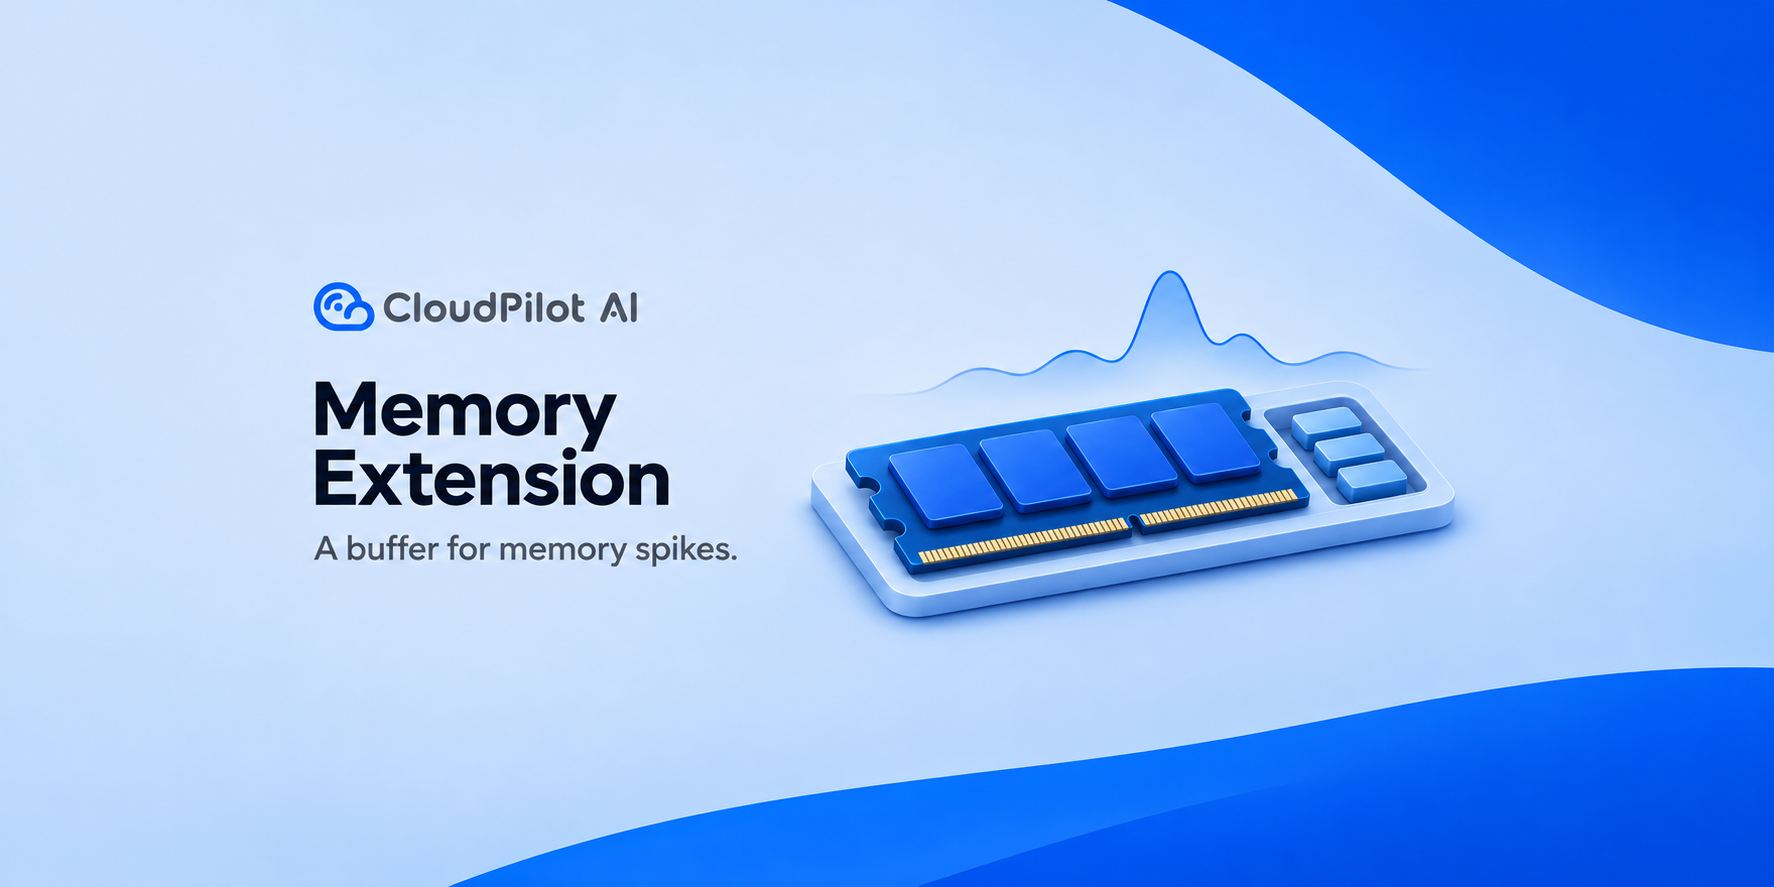
Memory Extension in Practice: Reducing OOM Risk During Memory Spikes
EKS tests show how CloudPilot AI Memory Extension can absorb memory spikes, when swap increases request latency, and how to configure NodeClass and NodePool.
CloudPilot AINov 4, 202610 min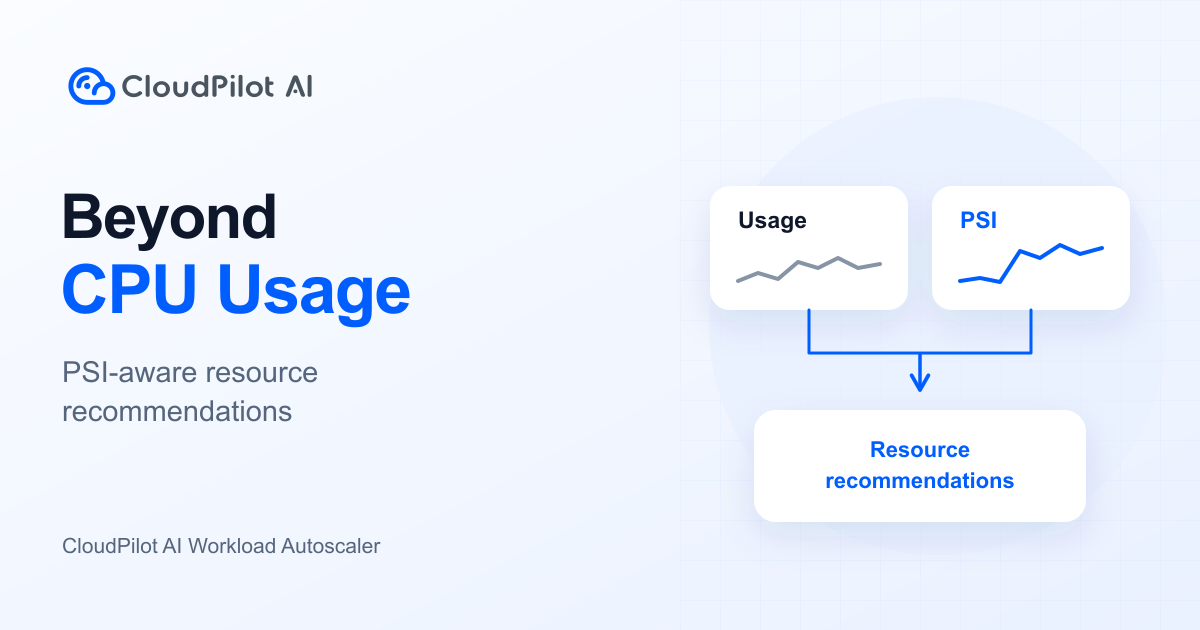
CPU Usage Looks Low. Why Is Your Application Still Slow?
CPU usage shows consumption, not waiting. Learn how CloudPilot AI Workload Autoscaler combines usage, PSI, and resource policies to right-size workloads.
CloudPilot AIOct 30, 20267 minThe Kubernetes Autoscaling Brief
Once a month: what we see in the Spot market, one real cluster torn down, and what shipped.
No spam. Unsubscribe anytime.